Editor: Katerine G., Editor & Data Researcher · Research & publishing: Electric Consumer Editorial Team · Data retrieved · Sources named on this page: EIA-861, EIA retail sales · How we got these numbers · Report an error
Salt River Project in Arizona: 13.46 ¢ home rates, SAIDI and solar
Roughly 1,166,094 Arizona accounts belong to Salt River Project, classed by EIA as political subdivision; the residential count is 1,053,407. Businesses and industry take 54% of the 33,577,274 MWh it sells; homes take 46%.
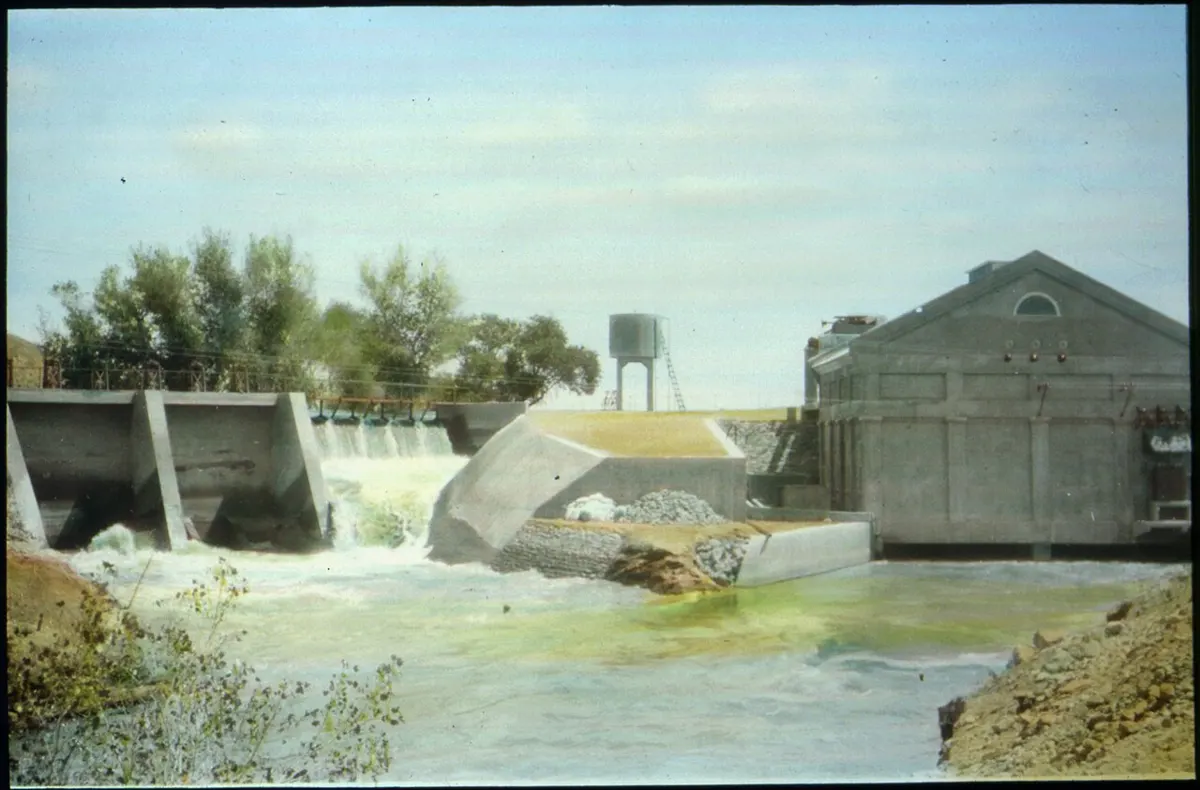
Salt River Project - Power Plant ^31 - Arizona - NARA - 294690. Photo by Unknown authorUnknown author or not provided, Public domain, Wikimedia Commons. Illustrative, not a listed utility's plant.
Salt River Project: 1,211 kWh a month costs roughly $163 in energy at 13.46 ¢/kWh, -9.7% on the Arizona average of 14.91 ¢.
Businesses and industry take 54% of the 33,577,274 MWh it sells; homes take 46%.
Who buys power from Salt River Project
Business share of sales
54%homes 46% of 33,577,274 MWh
The customer mix of Salt River Project is its own: 1,053,407 home accounts buy 45.6% of 33,577,274 MWh, 112,637 commercial accounts buy 41.0%, and the remaining 13.4% goes to 49 industrial and other accounts. A typical Salt River Project home uses 14,532 kWh a year, a typical business account 122,233.
How it compares
Salt River Project
Salt River Project, 2024
Home
Business
Bill
SAIDI
Salt River ProjectLowest in this table
13.46 ¢/kWh
10.76 ¢/kWh
$163at 1,211 kWh
53 minSAIDI
Arizona average against this company, which is 3 of 10 on price
Salt River Project: +3.9% on 2024 for homes, Arizona +2.7%.
Salt River Project home price, 2025
13.98 ¢/kWh+3.9% on 2024, early release
Salt River Project SAIDI, 2025
50 min-6% on 2024, early release
Salt River Project against Arizona, 2025
+1.1 pointsSalt River Project +3.9%, Arizona +2.7%, price in Arizona 15.32 ¢
Salt River Project reported 13.98 ¢/kWh for homes in 2025, +3.9% on its 2024 figure of 13.46, while the Arizona average moved +2.7%. Its SAIDI is 50 minutes against 53 in 2024.
Carbon context
Salt River Project serves 1,053,407 homes in Arizona. At 1,211 kWh a month that is about 377 kg of CO₂, or 4,527 kg a year, at the Arizona plant rate, state generation and not this utility: Arizona generation mix.
Salt River Project charts
Residential price since 2015: 13.46 ¢ in 2024
11.60 ¢ in 2015, 13.46 ¢ in 2024 (+16.1%); Arizona 12.13 to 14.91 ¢.
Salt River Project residential price 2015-2024, 2015 to 2024: 10 rows
Salt River Project billed homes 11.60 ¢/kWh in 2015 and 13.46 ¢ in 2024, +16.1% in all, and lagged the Arizona average (+22.9%) by 6.9 points. Salt River Project's sharpest move came in 2024, +7.9%. The latest year is the high at 13.46 ¢; the low was 11.45 ¢ (2020). 2024: +7.9% here, +6.3% for the Arizona average. SAIDI at Salt River Project (major events excluded) rose from 42 minutes in 2015 to 53 in 2024, +27%; worst year 2024 at 53. Against the national median, Salt River Project came in lower on SAIDI in 10 of 10 years, and 2024 ended at 53 minutes, -47 from the median. 2021: 85 minutes with major events, 48 without, the widest gap of any year. Salt River Project has 2 cheaper and 7 higher-priced Arizona peers among 10 with 20,000+ homes. Next cheaper, Navopache Electric Coop, Inc, bills 13.43 ¢ (-0.03). Next higher-priced, Sulphur Springs Valley E C Inc, bills 13.49 ¢ (+0.04).
Two good signs together. Rates are 9.7% below Arizona and outage time of 53 minutes beats the national median by 47%.
Home accounts at Salt River Project went from 914,246 in 2015 to 1,053,407 in 2024, +15.2%. Business customers paid 0.80 times the home price in 2024 (10.76 against 13.46 ¢); the ratio was 0.80 in 2015. SAIFI went from 0.66 in 2015 to 0.90 in 2024, between 0.57 and 0.90.
Outages and home price of Salt River Project (EIA utility 16572), 2013 to 2024
Salt River Project customers lost power for 53 minutes in 2024, up from 45 in 2013 (+18%). Its best year was 2018 (37 min), its worst 2024 (53 min), across 12 filed years. Against a Arizona median of 68 minutes in 2024, Salt River Project was below the middle.
Corrected for inflation, a Salt River Project home paid 13.81 ¢/kWh in 2024 against 15.46 ¢ in 2013, −10.7%; the bill itself went 11.19 ¢ to 13.46 ¢ (+20.3%). A home using 1,000 kWh a month paid $1,855 for the year at the 2013 real price and $1,657 at the 2024 price. Place on home price: 11th cheapest of 21 in 2013, 9th of 22 in 2024 among Arizona utilities with 1,000+ homes.
Salt River Project outage minutes a customer, 2013 to 2024: 53 in 2024
Salt River Project at 53 min in 2024 and the Arizona median at 68.
Salt River Project home price since 2013: −10.7% after inflation
Salt River Project: 13.81 ¢ in 2025 dollars (solid) and 13.46 ¢ as billed (dashed) in 2024.
Salt River Project, EIA utility 16572, year by year among Arizona utilities
Salt River Project 2013-2024: 12 rows
Year, Salt River Project
¢ billed
¢ in 2025 $
Price place, Salt River Pro
SAIDI min
SAIFI
SAIDI place, Salt River Pro
Arizona median SAIDI
2013
11.19
15.46
11 of 21
45
0.69
1 of 5
64
2014
11.32
15.40
12 of 22
40
0.62
1 of 5
58
2015
11.60
15.75
13 of 24
42
0.66
1 of 6
68
2016
11.61
15.57
15 of 26
43
0.63
2 of 7
65
2017
11.59
15.22
13 of 26
38
0.60
2 of 7
65
2018
11.68
14.98
10 of 27
37
0.57
4 of 10
44
2019
11.56
14.56
17 of 34
43
0.71
4 of 8
52
2020
11.45
14.24
9 of 22
41
0.69
4 of 8
45
2021
11.50
13.67
8 of 21
48
0.77
4 of 8
48
2022
11.88
13.07
6 of 22
50
0.85
4 of 9
55
2023
12.47
13.17
8 of 22
49
0.81
3 of 10
67
2024
13.46
13.81
9 of 22
53
0.90
3 of 11
68
Salt River Project, EIA utility 16572: EIA-861, CPI-U.
How big is Salt River Project in Arizona, by customer accounts?
1,166,094 accounts in 2024: residential 1,053,407, commercial 112,637, industrial 49.
How many cents per kWh does Salt River Project charge homes?
In 2024 homes paid 13.46 cents; against the Arizona average that is -9.7%.
What are the SAIDI and SAIFI of Salt River Project?
SAIDI 52.8 min and SAIFI 0.90 a year, major events excluded; ratio to the national median 0.53, CAIDI 59 min.
How many net-metered systems connect to Salt River Project?
60,692 installations with 545.5 MW, of which residential installations number 59,735.
What would a typical Salt River Project home pay each month?
1,211 kWh at 13.46 cents comes to about $163, energy only.
Is Salt River Project cheaper than other Arizona utilities?
Rank 3 of 10 in Arizona on price, -9.7% against the state average; 2 charge less than 13.46 ¢.
What share of Salt River Project sales do homes buy?
Homes take 45.6% of 33,577,274 MWh, commercial accounts 41.0%, industrial and other 13.4%; the 112,637 commercial accounts use 122,233 kWh each, 8.4 times a home.
At Salt River Project, are smart meters in homes, with a TOU option?
1,135,927 of 1,136,753 home meters are AMI, 99.9%. Salt River Project offers a home time-of-use rate; 360,794 customers use dynamic pricing, 34.25% of its homes.
Has Salt River Project moved up the Arizona price list since 2015?
4th cheapest of 10 in 2015, 3rd of 10 in 2024; its price rose 16.1% while Arizona rose 22.9%.
What did Salt River Project charge homes in 2025?
13.98 cents per kWh, +3.9% on the 13.46 of 2024 (EIA early release for 2025).
Utilities with a similar home price
Home prices nearest to Salt River Project at 13.46 ¢/kWh in 2024, among companies with a page here, any state.