Press kit
Facts, numbers and images for journalists, bloggers and teachers. Everything below can be used with a link back. Data as of 2 October 2026.
What you can quote
- Any number on the site, with the page link and the name “Electric Consumer”.
- The headline numbers below, each with the page that shows how it is computed.
- Charts and maps: use the “Download chart” buttons on the page (PNG or SVG, with the source printed inside the image) or the embed code at the foot of state and ranking pages.
License of the data
The underlying files are U.S. government works (U.S. Energy Information Administration, U.S. Census Bureau, NOAA, FEMA, DOE) and are in the public domain; cite the agency. Some layers use CC BY datasets (URDB, DOE LEAD), credited on the pages that use them. Our own compiled tables, rankings and charts are licensed CC BY 4.0: credit “Electric Consumer” and link the page you use. No permission needed. The CSV files are on the data page; method and limits are on Method and limits.
Headline numbers
Read from the ranking pages at build time. Download as CSV.
| Number | What it is | Page | Source |
|---|---|---|---|
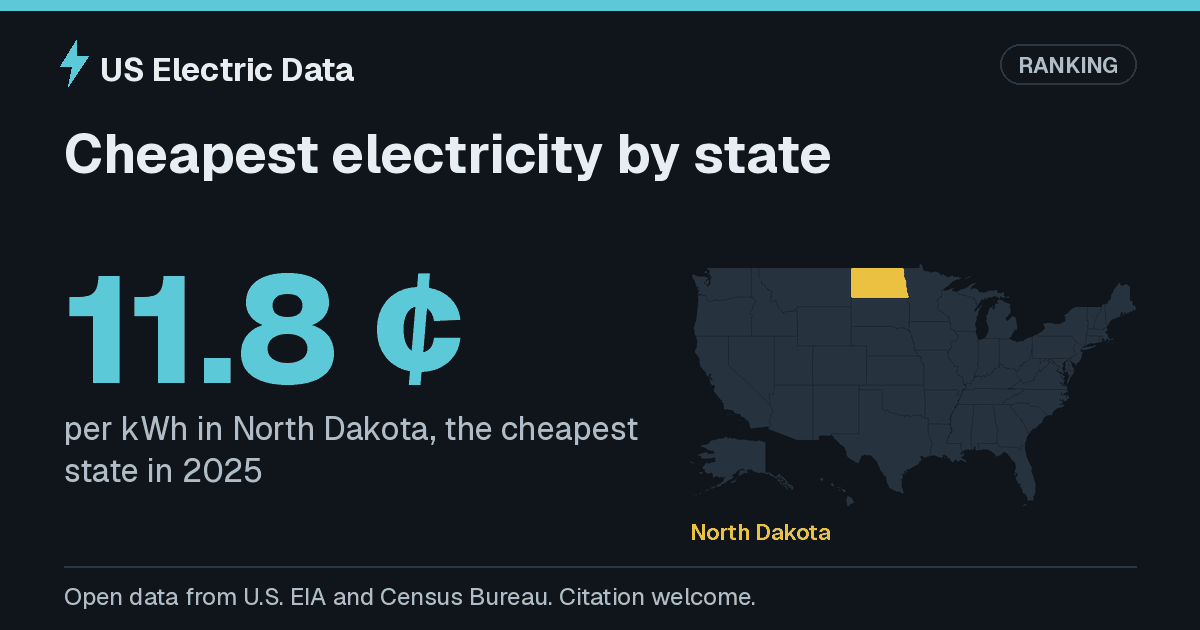
| 11.8 ¢ | per kWh in North Dakota, the cheapest state in 2025 | Cheapest electricity by state | EIA retail sales |
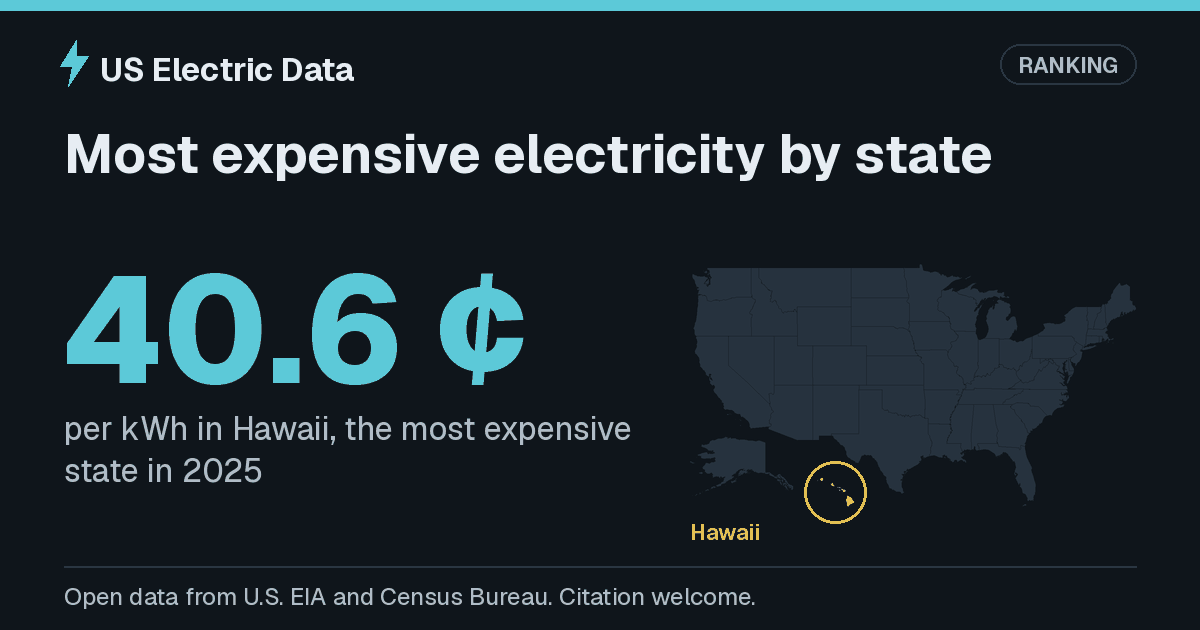
| 40.6 ¢ | per kWh in Hawaii, the most expensive state in 2025 | Most expensive electricity by state | EIA retail sales |
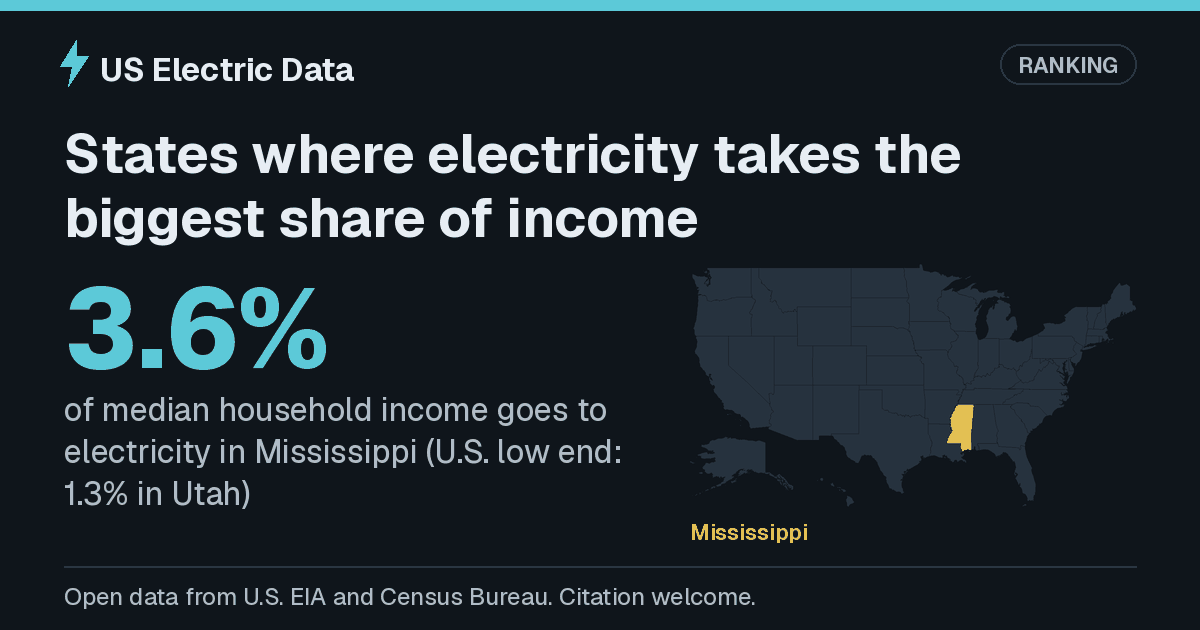
| 3.6% | of median household income goes to electricity in Mississippi (U.S. low end: 1.3% in Utah) | States where electricity takes the biggest share of income | EIA retail sales, Census ACS |
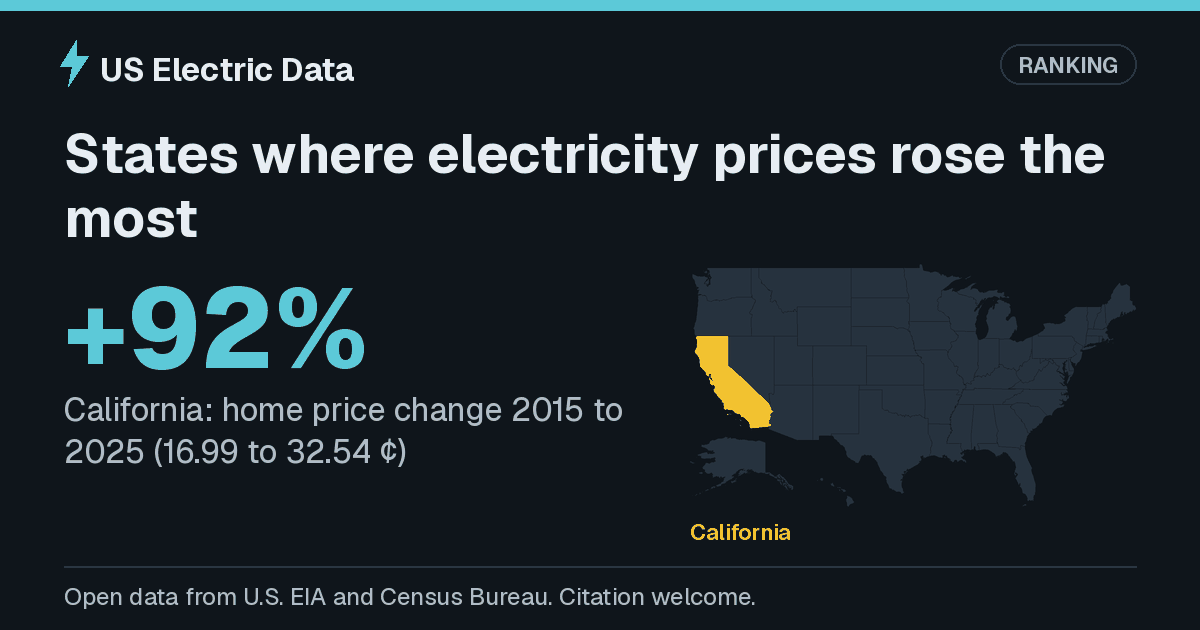
| +92% | California: home price change 2015 to 2025 (16.99 to 32.54 ¢) | States where electricity prices rose the most | EIA retail sales |
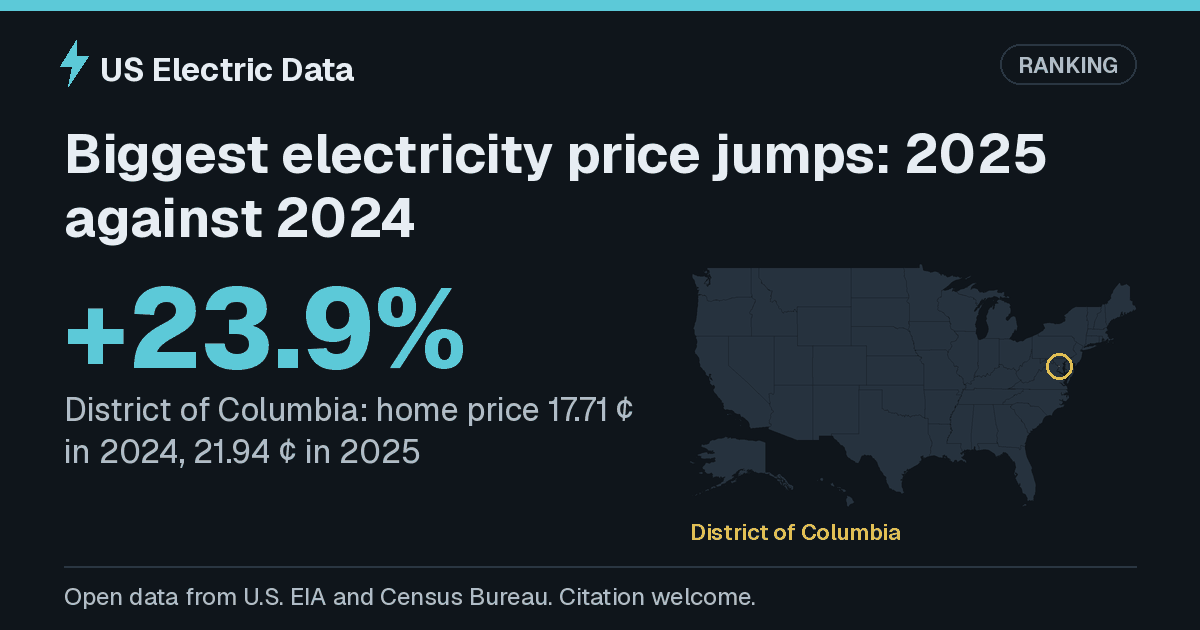
| +23.9% | District of Columbia: home price 17.71 ¢ in 2024, 21.94 ¢ in 2025 | Biggest electricity price jumps: 2025 against 2024 | EIA retail sales |
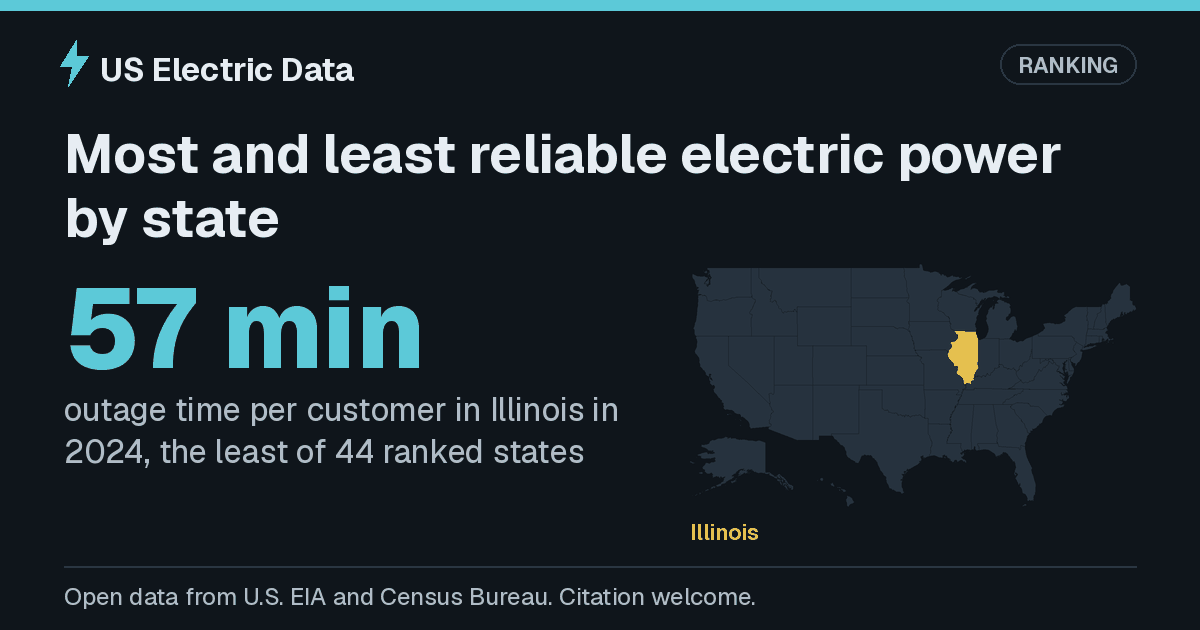
| 57 min | outage time per customer in Illinois in 2024, the least of 44 ranked states | Most and least reliable electric power by state | EIA-861 |
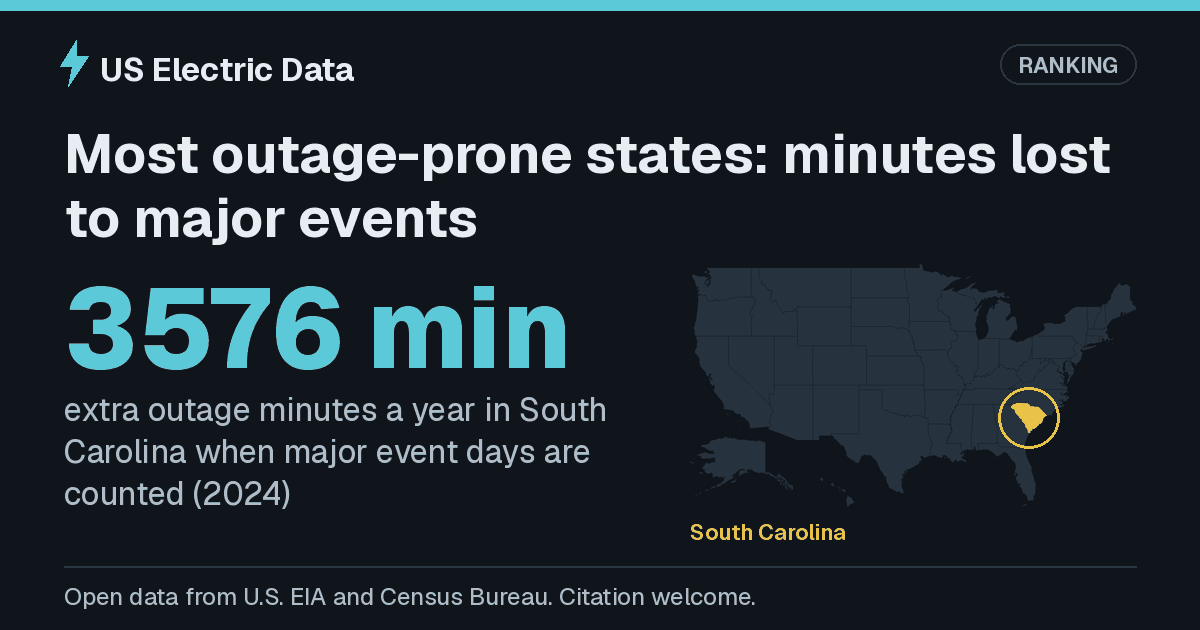
| 3576 min | extra outage minutes a year in South Carolina when major event days are counted (2024) | Most outage-prone states: minutes lost to major events | EIA-861 |
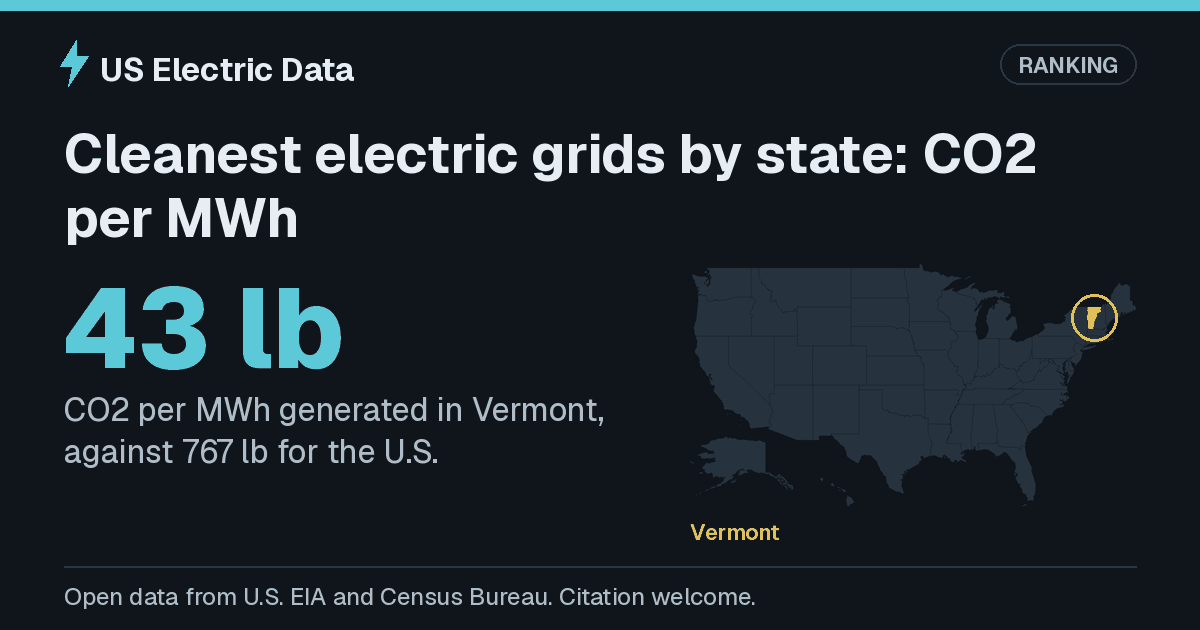
| 43 lb | CO2 per MWh generated in Vermont, against 767 lb for the U.S. | Cleanest electric grids by state: CO2 per MWh | EPA eGRID, EIA-923 and 860 |
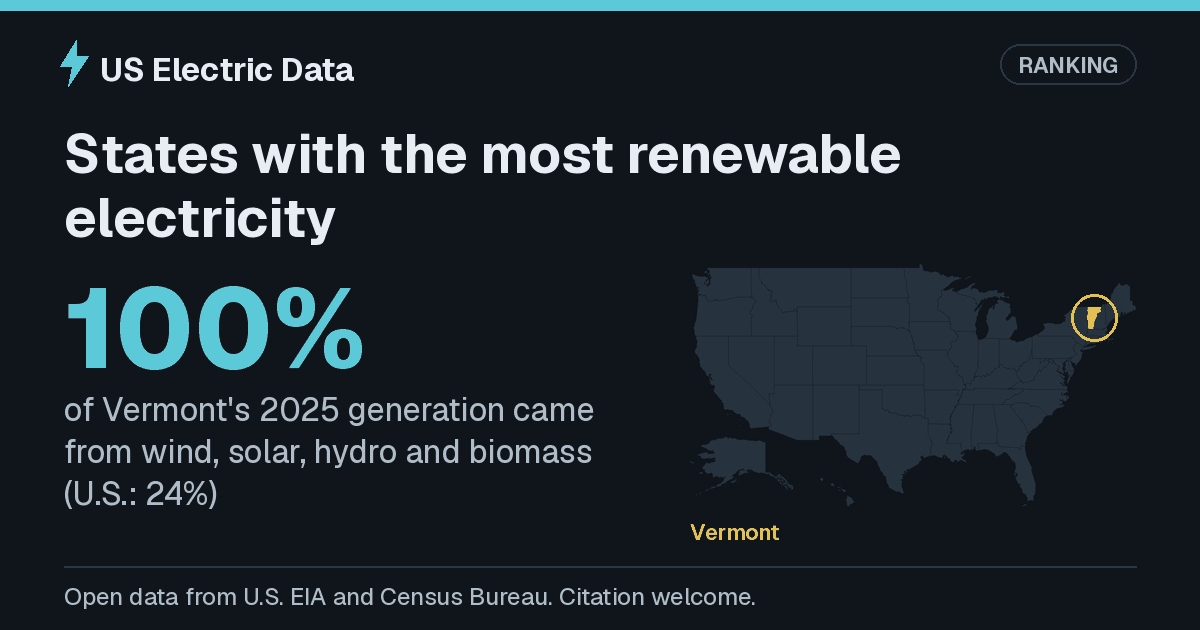
| 100% | of Vermont's 2025 generation came from wind, solar, hydro and biomass (U.S.: 24%) | States with the most renewable electricity | EIA-923 and 860 |
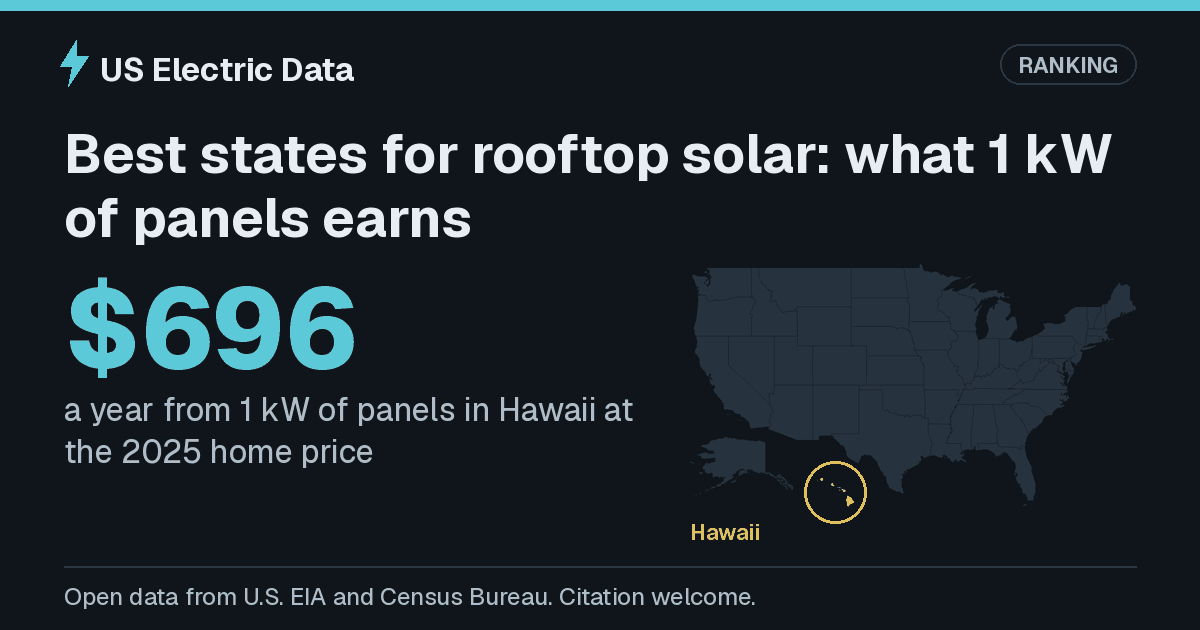
| $696 | a year from 1 kW of panels in Hawaii at the 2025 home price | Best states for rooftop solar: what 1 kW of panels earns | PVWatts, EIA retail sales, EIA-861 |
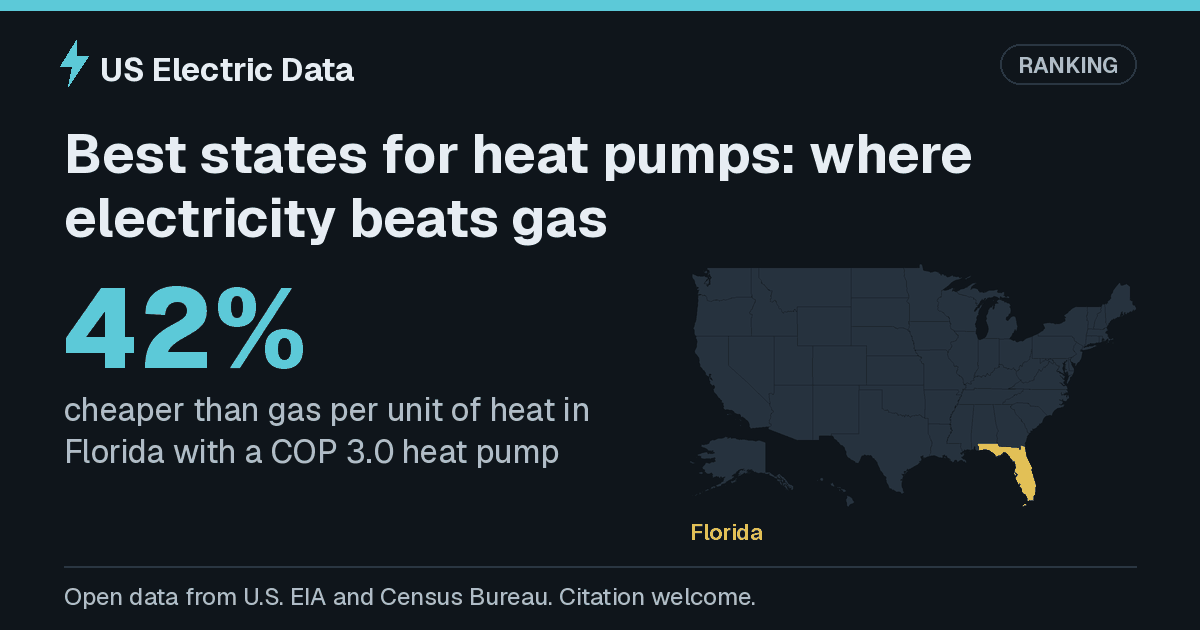
| 42% | cheaper than gas per unit of heat in Florida with a COP 3.0 heat pump | Best states for heat pumps: where electricity beats gas | EIA retail sales, EIA gas prices, NOAA degree-days |
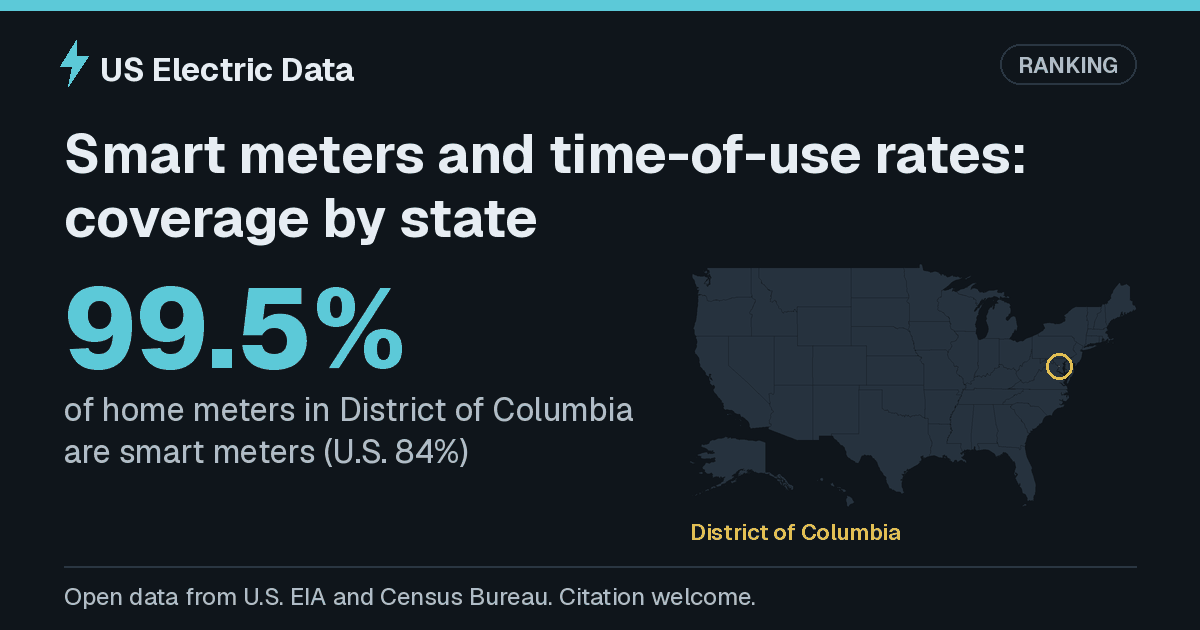
| 99.5% | of home meters in District of Columbia are smart meters (U.S. 84%) | Smart meters and time-of-use rates: coverage by state | EIA-861 |
How to cite
Every state page and ranking has a “Cite this page” box with APA, MLA, Chicago and BibTeX. Short form: Electric Consumer, “[page title]”, data as of 2 October 2026, https://electricconsumer.org/[page].
Images
Share cards (1200 by 630 px) for the home page and the main rankings. Every page has its own card in /og/.
- Home (PNG 1200x630)
- Cheapest electricity by state (PNG 1200x630)
- Most expensive electricity by state (PNG 1200x630)
- Highest electricity burden by state (PNG 1200x630)
- Fastest rising electricity prices (PNG 1200x630)
- Biggest electricity price jump 2025 (PNG 1200x630)
- Most reliable power by state (PNG 1200x630)
- Most outage prone states major events (PNG 1200x630)
- Cleanest electricity by state (PNG 1200x630)
- Most renewable electricity by state (PNG 1200x630)
- Best states for rooftop solar (PNG 1200x630)
- Best states for heat pumps (PNG 1200x630)
- Smart meter and time of use coverage by state (PNG 1200x630)
Wordmark (SVG) and wordmark (PNG), free to use with a link to the site.


Widgets
102 free iframe widgets (price and typical bill for each state): embeddable widgets. Charts can also be copied as SVG from any state or ranking page.
Contact
Corrections and press questions: see the contact page.
Ready-made post texts for social networks are on the share kit page.