Editor: Katerine G., Editor & Data Researcher · Research & publishing: Electric Consumer Editorial Team · Data retrieved · Sources named on this page: EIA-861, EIA retail sales · How we got these numbers · Report an error
City of Seattle electricity: 512,498 accounts in Washington, SAIDI 111
Roughly 512,498 Washington accounts belong to City of Seattle, classed by EIA as municipal; the residential count is 459,964. Its home price sits 18.4% over the Washington average and ranks 17 of 18 among larger utilities.
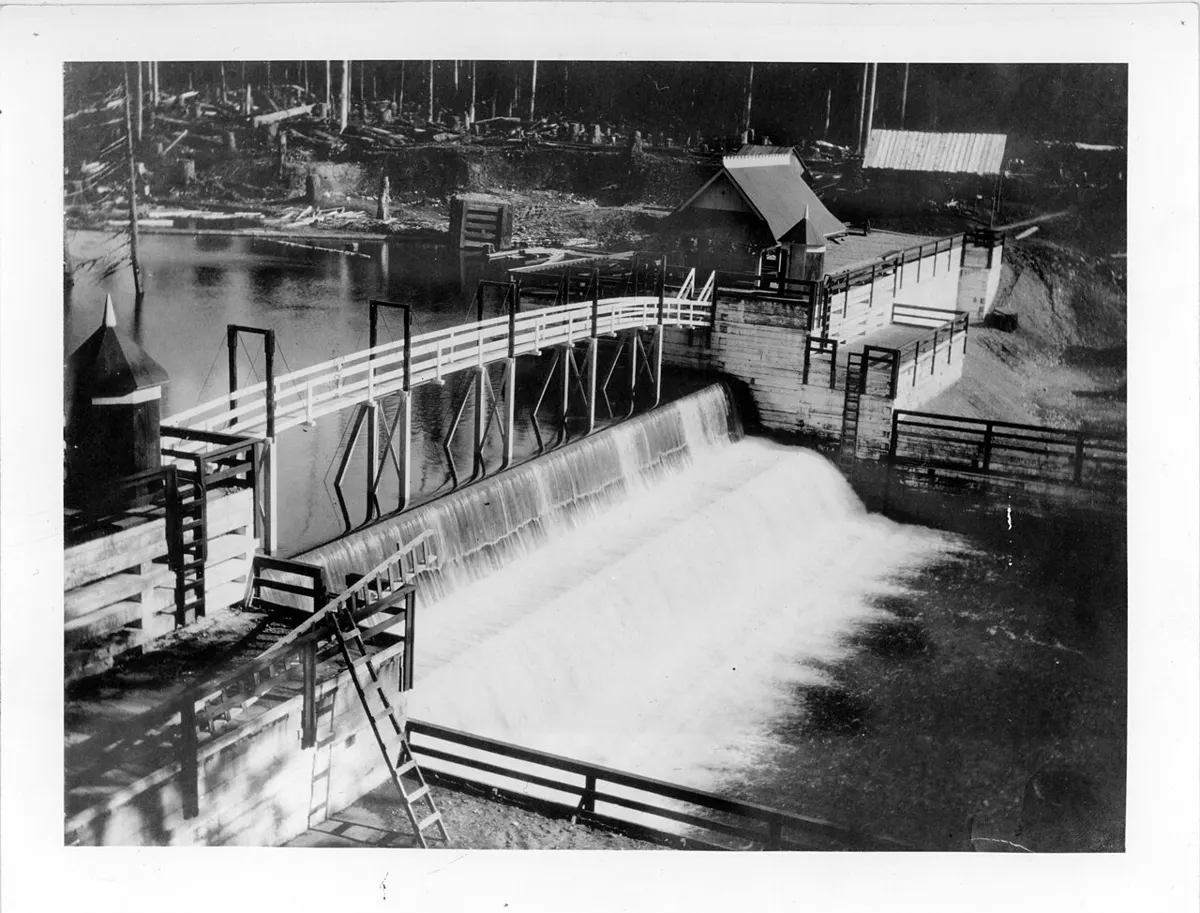
Cedar Falls crib dam, 1903. Photo by Seattle Municipal Archives from Seattle, WA, CC BY 2.0, Wikimedia Commons. Illustrative, not a listed utility's plant.
City of Seattle: 601 kWh a month costs roughly $85 in energy at 14.09 ¢/kWh, +18.4% on the Washington average of 11.90 ¢.
Its home price sits 18.4% over the Washington average and ranks 17 of 18 among larger utilities.
City of Seattle on price: 18.4% over Washington
Home price against Washington
+18.4%place 17 of 18, cheapest first
Home price is where City of Seattle departs furthest from the Washington pattern: 14.09 ¢ against a state average of 11.90 ¢, place 17 of 18 among Washington utilities with 20,000+ homes. The cheapest of those is PUD No 1 of Chelan County at 3.67 ¢ (-10.42 ¢ from here), the most expensive Puget Sound Energy Inc at 14.63 ¢ (+0.55 ¢).
A home using 601 kWh a month pays about $85 in energy here; at the Washington average the same use would cost $72, a difference of +$13 a month.
How it compares
City of Seattle
City of Seattle, 2024
Home
Business
Bill
SAIDI
City of Seattle
14.09 ¢/kWh
11.77 ¢/kWh
$85at 601 kWh
111 minSAIDI
Washington average against this company, which is 17 of 18 on priceLowest in this table
City of Seattle: +4.6% on 2024 for homes, Washington +10.2%.
City of Seattle home price, 2025
14.74 ¢/kWh+4.6% on 2024, early release
City of Seattle SAIDI, 2025
129 min+17% on 2024, early release
City of Seattle against Washington, 2025
-5.6 pointsCity of Seattle +4.6%, Washington +10.2%, price in Washington 13.11 ¢
City of Seattle reported 14.74 ¢/kWh for homes in 2025, +4.6% on its 2024 figure of 14.09, while the Washington average moved +10.2%. Its SAIDI is 129 minutes against 111 in 2024.
Carbon context
City of Seattle serves 459,964 homes in Washington. At 601 kWh a month that is about 72 kg of CO₂, or 868 kg a year, at the Washington plant rate, state generation and not this utility: Washington generation mix.
City of Seattle charts
Residential price since 2015: 14.09 ¢ in 2024
9.08 ¢ in 2015, 14.09 ¢ in 2024 (+55.2%); Washington 9.09 to 11.90 ¢.
City of Seattle residential price 2015-2024, 2015 to 2024: 10 rows
City of Seattle billed homes 9.08 ¢/kWh in 2015 and 14.09 ¢ in 2024, +55.2% in all, and outpaced the Washington average (+30.9%) by 24.3 points. City of Seattle's sharpest move came in 2017, +11.7%. The latest year is the high at 14.09 ¢; the low was 9.08 ¢ (2015). 2024: +10.2% here, +8.4% for the Washington average. SAIDI at City of Seattle (major events excluded) rose from 62 minutes in 2015 to 111 in 2024, +77%; worst year 2024 at 111. At 111 minutes in 2024, City of Seattle sat +11 from the national SAIDI median, with 8 of 10 years below it. 2024: 324 minutes with major events, 111 without, the widest gap of any year. City of Seattle has 16 cheaper and 1 higher-priced Washington peers among 18 with 20,000+ homes. Next cheaper, PUD No 3 of Mason County, bills 13.79 ¢ (-0.30). Next higher-priced, Puget Sound Energy Inc, bills 14.63 ¢ (+0.55).
A 18.4% premium over Washington, with outage minutes at 1.11x the national median.
Home accounts at City of Seattle went from 381,419 in 2015 to 459,964 in 2024, +20.6%. Business customers paid 0.84 times the home price in 2024 (11.77 against 14.09 ¢); the ratio was 0.85 in 2015. SAIFI went from 0.50 in 2015 to 0.76 in 2024, between 0.45 and 0.76.
Outages and home price of City of Seattle (EIA utility 16868), 2013 to 2024
By 2024 the average City of Seattle customer sat through 111 minutes of outage, against 69 in 2013 (+61%). Its best year was 2018 (58 min), its worst 2024 (111 min), across 12 filed years. Against a Washington median of 136 minutes in 2024, City of Seattle was below the middle.
Corrected for inflation, a City of Seattle home paid 14.46 ¢/kWh in 2024 against 11.34 ¢ in 2013, +27.6%; the bill itself went 8.20 ¢ to 14.09 ¢ (+71.8%). A home using 1,000 kWh a month paid $1,360 for the year at the 2013 real price and $1,735 at the 2024 price. Place on home price: 27th cheapest of 46 in 2013, 34th of 37 in 2024 among Washington utilities with 1,000+ homes.
City of Seattle outage minutes a customer, 2013 to 2024: 111 in 2024
City of Seattle at 111 min in 2024 and the Washington median at 136.
City of Seattle home price since 2013: +27.6% after inflation
City of Seattle: 14.46 ¢ in 2025 dollars (solid) and 14.09 ¢ as billed (dashed) in 2024.
City of Seattle, EIA utility 16868, year by year among Washington utilities
City of Seattle 2013-2024: 12 rows
Year, City of Seattle
¢ billed
¢ in 2025 $
Price place, City of Seattl
SAIDI min
SAIFI
SAIDI place, City of Seattl
Washington median SAIDI
2013
8.20
11.34
27 of 46
69
0.90
3 of 9
85
2014
8.75
11.90
31 of 46
69
0.89
3 of 10
103
2015
9.08
12.33
30 of 46
62
0.50
7 of 12
60
2016
9.44
12.66
33 of 46
61
0.50
6 of 14
94
2017
10.55
13.86
38 of 46
64
0.45
6 of 14
122
2018
10.72
13.74
37 of 46
58
0.50
7 of 17
117
2019
11.37
14.31
47 of 53
75
0.49
8 of 19
91
2020
11.87
14.76
34 of 37
67
0.49
4 of 18
122
2021
11.85
14.08
34 of 37
107
0.66
9 of 18
122
2022
12.12
13.33
34 of 37
101
0.63
9 of 19
136
2023
12.78
13.50
35 of 38
96
0.60
9 of 20
104
2024
14.09
14.46
34 of 37
111
0.76
8 of 21
136
City of Seattle, EIA utility 16868: EIA-861, CPI-U.
How big is City of Seattle in Washington, by customer accounts?
512,498 accounts in 2024: residential 459,964, commercial 52,473, industrial 58.
How many cents per kWh does City of Seattle charge homes?
In 2024 homes paid 14.09 cents; against the Washington average that is +18.4%.
What are the SAIDI and SAIFI of City of Seattle?
SAIDI 110.8 min and SAIFI 0.76 a year, major events excluded; ratio to the national median 1.11, CAIDI 146 min.
How many net-metered systems connect to City of Seattle?
8,008 installations with 64.2 MW, of which residential installations number 7,560.
What would a typical City of Seattle home pay each month?
601 kWh at 14.09 cents comes to about $85, energy only.
Is City of Seattle cheaper than other Washington utilities?
Rank 17 of 18 in Washington on price, +18.4% against the state average; 16 charge less than 14.09 ¢.
What share of City of Seattle sales do homes buy?
Homes take 36.7% of 9,042,276 MWh, commercial accounts 54.8%, industrial and other 8.5%; the 52,473 commercial accounts use 94,418 kWh each, 13.1 times a home.
At City of Seattle, are smart meters in homes, with a TOU option?
446,569 of 450,758 home meters are AMI, 99.1%. City of Seattle offers a home time-of-use rate; 159 customers use dynamic pricing, 0.03% of its homes.
Has City of Seattle moved up the Washington price list since 2015?
10th cheapest of 18 in 2015, 17th of 18 in 2024; its price rose 55.2% while Washington rose 30.9%.
Where does City of Seattle stand among 2 peers?
Place 3 of 3 on home price at 14.09 ¢ (Washington municipals); median 10.81 ¢, cheapest member 9.82 ¢.
What did City of Seattle charge homes in 2025?
14.74 cents per kWh, +4.6% on the 14.09 of 2024 (EIA early release for 2025).
Utilities with a similar home price
Home prices nearest to City of Seattle at 14.09 ¢/kWh in 2024, among companies with a page here, any state.