Editor: Katerine G., Editor & Data Researcher · Research & publishing: Electric Consumer Editorial Team · Data retrieved · Sources named on this page: EIA-861, EIA retail sales · How we got these numbers · Report an error
Provo City Corp in Utah: 11.39 ¢ home rates in 2024, SAIDI and solar
Roughly 40,057 Utah accounts belong to Provo City Corp, classed by EIA as municipal; the residential count is 35,299. Its SAIDI of 35 minutes is 0.36 times the national median reporter (99).
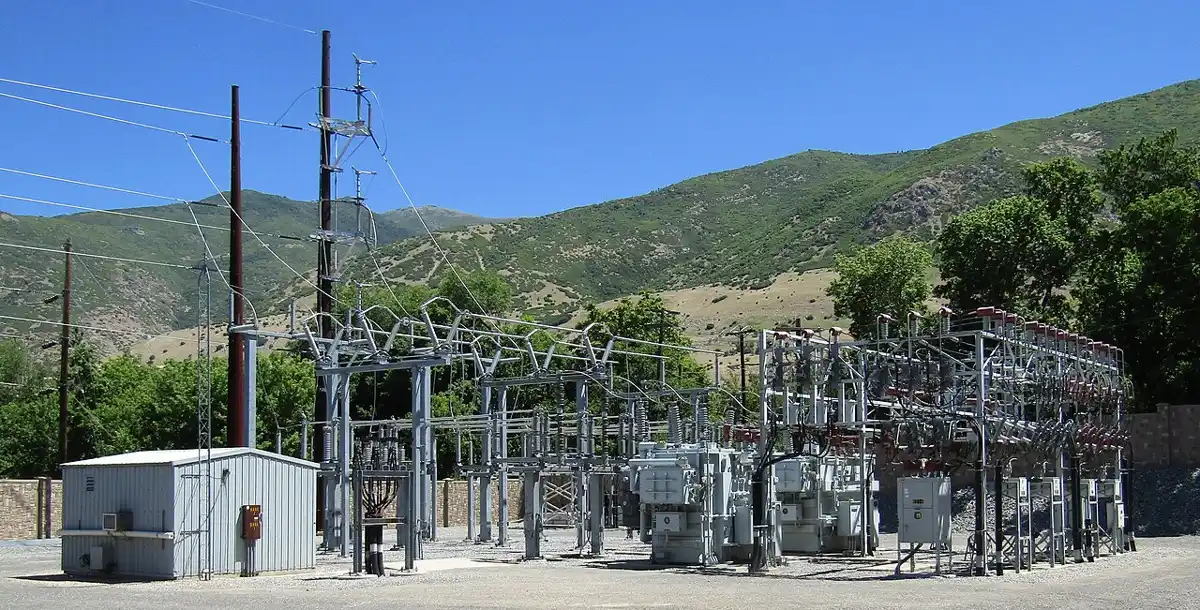
Farmington Substation. Photo by Ben P L from Provo, USA, CC BY-SA 2.0, Wikimedia Commons. Illustrative, not a listed utility's plant.
At 610 kWh a month a Provo City Corp home pays about $69 in energy: 11.39 ¢/kWh, 6.8% below the Utah average of 12.22 ¢.
Its SAIDI of 35 minutes is 0.36 times the national median reporter (99).
Provo City Corp: outage minutes
SAIDI against national median
0.36x35 minutes against 99
Reliability is the sharpest contrast for Provo City Corp: 35 minutes a year without power per customer, 0.36 times the national median of 99. Among 5 Utah utilities that report SAIDI it ranks 3 (1 = fewest minutes); the Utah median is 39.
SAIFI adds the frequency view: 0.47 interruptions a customer a year, 0.46 times the national median (1.01), with 75 minutes per interruption.
How it compares
Provo City Corp
Provo City Corp, 2024
Home
Business
Bill
SAIDI
Provo City CorpLowest in this table
11.39 ¢/kWh
9.33 ¢/kWh
$69at 610 kWh
35 minSAIDI
Utah average against this company, which is 3 of 5 on price
Provo City Corp: -0.1% on 2024 for homes, Utah +6.5%.
Provo City Corp home price, 2025
11.38 ¢/kWh-0.1% on 2024, early release
Provo City Corp SAIDI, 2025
53 min+51% on 2024, early release
Provo City Corp against Utah, 2025
-6.6 pointsProvo City Corp -0.1%, Utah +6.5%, price in Utah 13.02 ¢
Provo City Corp reported 11.38 ¢/kWh for homes in 2025, -0.1% on its 2024 figure of 11.39, while the Utah average moved +6.5%. Its SAIDI is 53 minutes against 35 in 2024.
Carbon context
Provo City Corp serves 35,299 homes in Utah. At 610 kWh a month that is about 391 kg of CO₂, or 4,688 kg a year, at the Utah plant rate, state generation and not this utility: Utah generation mix.
Provo City Corp charts
Residential price since 2015: 11.39 ¢ in 2024
10.14 ¢ in 2015, 11.39 ¢ in 2024 (+12.3%); Utah 10.88 to 12.22 ¢.
Provo City Corp residential price 2015-2024, 2015 to 2024: 10 rows
Provo City Corp billed homes 10.14 ¢/kWh in 2015 and 11.39 ¢ in 2024, +12.3% in all, and tracked the Utah average (+12.3%) within 0.0 points. Provo City Corp's sharpest move came in 2020, +4.2%. The latest year is the high at 11.39 ¢; the low was 10.14 ¢ (2015). 2024: +0.9% here, +9.1% for the Utah average. SAIDI at Provo City Corp (major events excluded) rose from 25 minutes in 2015 to 35 in 2024, +43%; worst year 2019 at 48. Provo City Corp filed SAIDI under the national median in 10 of 10 years; its 2024 figure was 35 minutes, -64 from that year's median. 2016: 82 minutes with major events, 13 without, the widest gap of any year. Provo City Corp has 2 cheaper and 2 higher-priced Utah peers among 5 with 20,000+ homes. Next cheaper, Lehi City Corporation, bills 10.95 ¢ (-0.44). Next higher-priced, City of St George, bills 11.40 ¢ (+0.01).
Two good signs together. Rates are 6.8% below Utah and outage time of 35 minutes beats the national median by 64%.
Home accounts at Provo City Corp went from 31,821 in 2015 to 35,299 in 2024, +10.9%. Business customers paid 0.82 times the home price in 2024 (9.33 against 11.39 ¢); the ratio was 0.84 in 2015. SAIFI went from 0.17 in 2015 to 0.47 in 2024, between 0.14 and 0.76.
Outages and home price of Provo City Corp (EIA utility 15444), 2013 to 2024
Provo City Corp customers lost power for 35 minutes in 2024, up from 18 in 2014 (+101%). Its best year was 2016 (13 min), its worst 2019 (48 min), across 11 filed years. Against a Utah median of 35 minutes in 2024, Provo City Corp was level with the middle.
Corrected for inflation, a Provo City Corp home paid 11.69 ¢/kWh in 2024 against 13.85 ¢ in 2013, −15.6%; the bill itself went 10.03 ¢ to 11.39 ¢ (+13.6%). A home using 1,000 kWh a month paid $1,662 for the year at the 2013 real price and $1,403 at the 2024 price. Place on home price: 16th cheapest of 22 in 2013, 6th of 15 in 2024 among Utah utilities with 1,000+ homes.
Provo City Corp outage minutes a customer, 2014 to 2024: 35 in 2024
Provo City Corp at 35 min in 2024 and the Utah median at 35.
Provo City Corp home price since 2013: −15.6% after inflation
Provo City Corp: 11.69 ¢ in 2025 dollars (solid) and 11.39 ¢ as billed (dashed) in 2024.
Provo City Corp, EIA utility 15444, year by year among Utah utilities
Provo City Corp 2013-2024: 12 rows
Year, Provo City Corp
¢ billed
¢ in 2025 $
Price place, Provo City Corp
SAIDI min
SAIFI
SAIDI place, Provo City Corp
Utah median SAIDI
2013
10.03
13.85
16 of 22
–
–
–
–
2014
9.92
13.50
13 of 22
18
0.25
2 of 5
41
2015
10.14
13.78
14 of 22
25
0.17
3 of 6
30
2016
10.38
13.92
16 of 22
13
0.14
4 of 8
26
2017
10.39
13.64
15 of 23
35
0.35
6 of 8
31
2018
10.51
13.47
15 of 23
47
0.48
5 of 7
43
2019
10.73
13.51
27 of 34
48
0.76
6 of 7
37
2020
11.18
13.90
14 of 15
22
0.24
3 of 5
22
2021
10.99
13.06
12 of 15
25
0.53
3 of 5
25
2022
10.88
11.97
9 of 15
18
0.20
1 of 5
43
2023
11.29
11.93
9 of 15
33
0.51
1 of 5
35
2024
11.39
11.69
6 of 15
35
0.47
3 of 5
35
Provo City Corp, EIA utility 15444: EIA-861, CPI-U.
Provo City Corp files with EIA as a municipal utility. In Utah, municipal utilities serve 14% of residential customers at an average 11.5 cents per kWh, 8% below investor-owned utilities in Utah. Provo City Corp itself averaged 11.4 cents, 0.2 cents below its type in Utah.
Shutoffs: this utility reported 5,099 disconnections for nonpayment in 2024, 14.6 per 100 accounts (Utah: 2.7; EIA Form EIA-112). All utilities.
Reliability and meters, 2024
In 2024 the average Provo City Corp customer was without power 35 minutes without major events and 35 with them. That is 3rd fewest of 5 Utah utilities with 10,000+ customers. The median Utah utility reported 35 minutes. Smart (AMI) meters: 100% of its 35,299 residential meters.
How big is Provo City Corp in Utah, by customer accounts?
40,057 accounts in 2024: residential 35,299, commercial 4,757, industrial 1.
How many cents per kWh does Provo City Corp charge homes?
In 2024 homes paid 11.39 cents; against the Utah average that is -6.8%.
What are the SAIDI and SAIFI of Provo City Corp?
SAIDI 35.4 min and SAIFI 0.47 a year, major events excluded; ratio to the national median 0.36, CAIDI 75 min.
How many net-metered systems connect to Provo City Corp?
1,239 installations with 8.8 MW, of which residential installations number 1,219.
What would a typical Provo City Corp home pay each month?
610 kWh at 11.39 cents comes to about $69, energy only.
Is Provo City Corp cheaper than other Utah utilities?
Rank 3 of 5 in Utah on price, -6.8% against the state average; 2 charge less than 11.39 ¢.
How much of the Provo City Corp load is business?
Homes take 33.3% of 775,371 MWh, commercial accounts 49.6%, industrial and other 17.1%; the 4,757 commercial accounts use 80,800 kWh each, 11.0 times a home.
Does Provo City Corp have smart meters or TOU rates?
35,299 of 35,299 home meters are AMI, 100.0%. Provo City Corp offers a home time-of-use rate; 23 customers use dynamic pricing, 0.07% of its homes.
Since 2015, has Provo City Corp become cheaper than other Utah utilities?
2nd cheapest of 3 in 2015, 3rd of 5 in 2024; its price rose 12.3% while Utah rose 12.3%.
What did Provo City Corp charge homes in 2025?
11.38 cents per kWh, -0.1% on the 11.39 of 2024 (EIA early release for 2025).
Utilities with a similar home price
Home prices nearest to Provo City Corp at 11.39 ¢/kWh in 2024, among companies with a page here, any state.
EIA-861 form instructions for Provo City Corp in Utah: 11.39 ¢ home rates in 2024, SAIDI and solar, how a customer is counted
EIA state profiles for Provo City Corp in Utah: 11.39 ¢ home rates in 2024, SAIDI and solar, the state price average
Share this page
At 610 kWh a month a Provo City Corp home pays about $69 in energy: 11.39 ¢/kWh, 6.8% below the Utah average of 12.22 ¢.
Cite this page
Underlying data are U.S. government works (EIA, Census Bureau). Our tables and charts: CC BY 4.0, credit Electric Consumer. The access date fills in when you open this page.
APA
Electric Consumer. (2026). Provo City Corp outage record: 11.38 ¢/kWh in 2025, SAIDI 35 min in 2024. Data as of 26 October 2026. Retrieved 26 October 2026, from https://electricconsumer.org/companies/provo-city-corp.html
MLA
Electric Consumer. “Provo City Corp outage record: 11.38 ¢/kWh in 2025, SAIDI 35 min in 2024.” Electric Consumer, data as of 26 October 2026, https://electricconsumer.org/companies/provo-city-corp.html. Accessed 26 October 2026.
Chicago
Electric Consumer. “Provo City Corp outage record: 11.38 ¢/kWh in 2025, SAIDI 35 min in 2024.” Data as of 26 October 2026. Accessed 26 October 2026. https://electricconsumer.org/companies/provo-city-corp.html.
BibTeX
@misc{usedata_companies_provo_city_corp,
  author = "Electric Consumer",
  title = {Provo City Corp outage record: 11.38 ¢/kWh in 2025, SAIDI 35 min in 2024},
  year = {2026},
  url = {https://electricconsumer.org/companies/provo-city-corp.html},
  note = {Data as of 26 October 2026. Accessed 26 October 2026}
}
Embed this chart or number
Free to use. No tracking, no scripts. Each embed links back to this site.
Charts on this page (SVG)
Copies a self-contained SVG with the source and a link to this page inside the image.